Using NCrunch to find bottlenecks visually
All examples are from NCrunch Version 1.40b.
NCrunch is a continuous test runner for C#. I enjoy using it to test my code with a less jarring mental switch. It displays the status of test runs in visual studio as a color coded circle. In addition, it shows the status next to each line that was run.
In addition to the red and green status colors for passing or failing tests, you may see black or yellow. Black shows code not covered by any test. Yellow is the focus of this post. NCrunch will display yellow for the longer test runs. You can see a short example here.
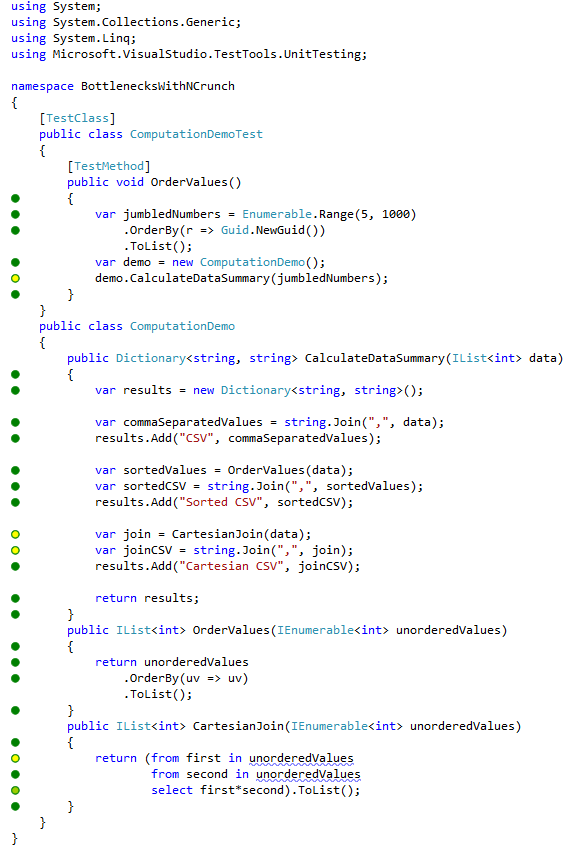
When I need to improve the run time of a program, I start by profiling it. I recently found that NCrunch makes this extremely easy. I write an integration test for the code I want to speed up. If I run just that test through NCrunch, I can pretty quickly find the hot spots in the code. If I hover over one of the yellow indicators as shown here, I can get a few more details.
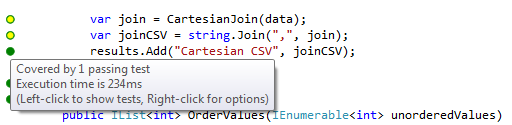
In this example, I see that the cartesian join data is fairly slow to convert to a comma separated list. Since I found a long running line of code, I may see if there is an issue to fix or a way it should be sped up. The color coded lines in NCrunch just make this process a lot easier when you start working with nested method calls involved in a slow run.